Charts
Create native PowerPoint charts that are editable in PowerPoint.
Chart Types
| Category | Types |
|---|---|
| Standard | bar, col, line, pie, area, scatter, doughnut, radar, bubble, stock, surface |
| 3D | bar3D, col3D, line3D, pie3D, area3D |
Column Chart
typescript
slide.addChart('col', {
  categories: ['Q1', 'Q2', 'Q3', 'Q4'],
  series: [
    { name: '2024', values: [120, 180, 150, 210], color: '4472C4' },
    { name: '2025', values: [140, 200, 190, 250], color: 'ED7D31' },
  ],
}, { x: 1, y: 1, w: 8, h: 5, title: 'Revenue', showLegend: true });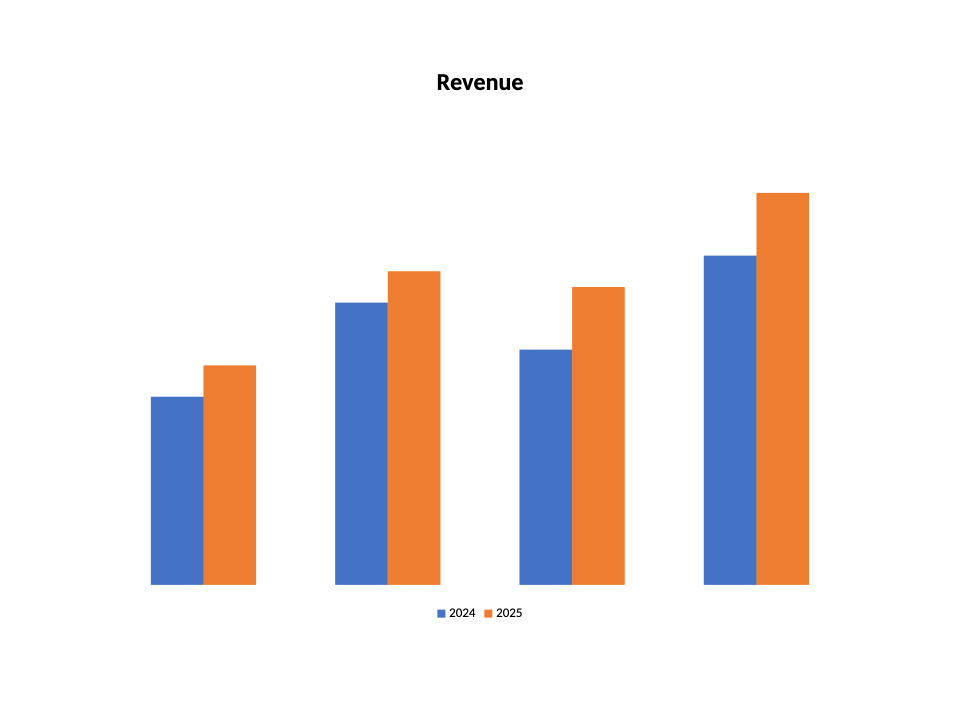
Pie Chart
typescript
slide.addChart('pie', {
  categories: ['Product A', 'Product B', 'Product C'],
  series: [{ name: 'Share', values: [45, 30, 25] }],
}, { x: 2, y: 1.5, w: 6, h: 5 });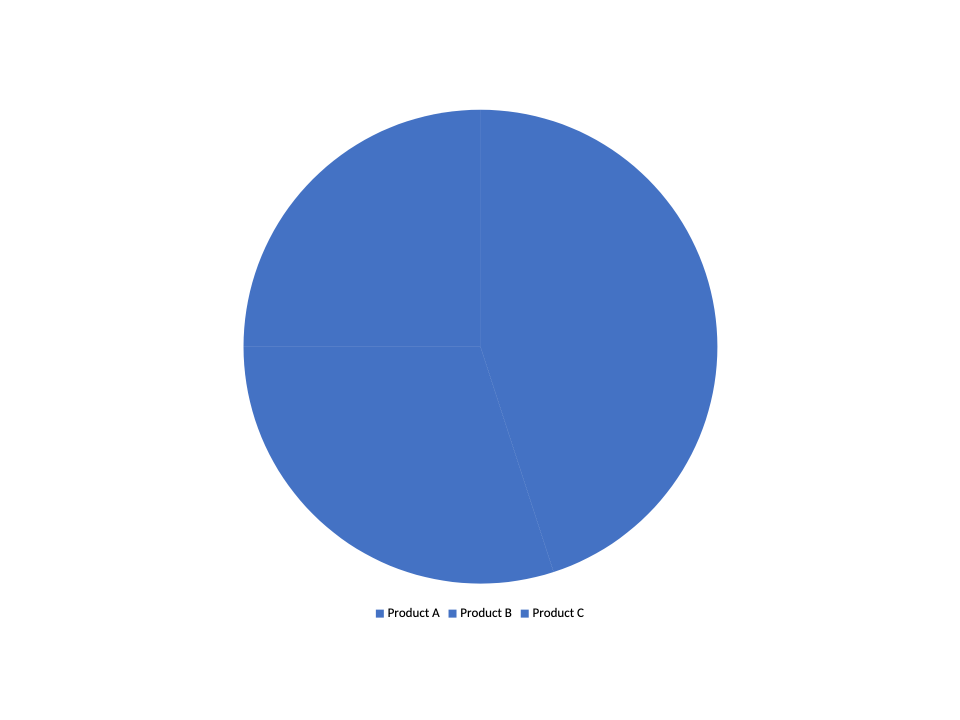
Line Chart
typescript
slide.addChart('line', {
  categories: ['Jan', 'Feb', 'Mar', 'Apr'],
  series: [
    { name: 'Trend A', values: [10, 20, 15, 25] },
    { name: 'Trend B', values: [5, 15, 20, 18] },
  ],
}, { x: 1, y: 1, w: 8, h: 5, showDataLabels: true, showLegend: true });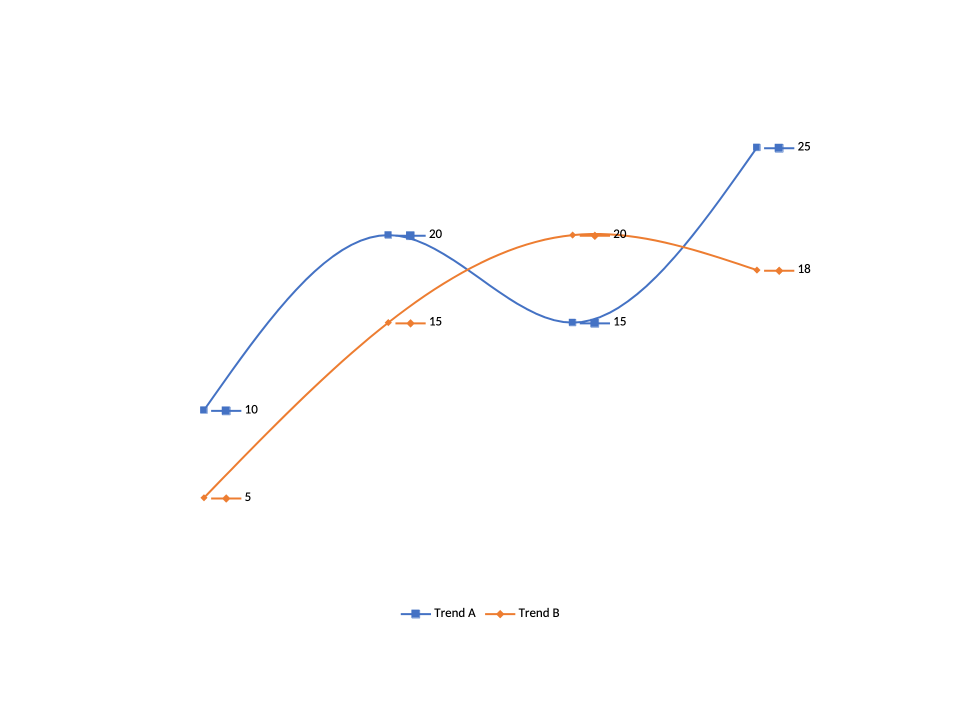
Scatter Chart
typescript
slide.addChart('scatter', {
  xValues: [1, 2, 3, 4, 5],
  series: [
    { name: 'Measurements', values: [2.1, 3.8, 3.2, 4.5, 5.1] },
  ],
}, {
  x: 1, y: 1, w: 8, h: 5,
  scatterStyle: 'lineMarker',
  catAxis: { title: 'X' },
  valAxis: { title: 'Y' },
});
Radar Chart
typescript
slide.addChart('radar', {
  categories: ['Speed', 'Reliability', 'Comfort', 'Safety', 'Efficiency'],
  series: [
    { name: 'Model A', values: [4, 3, 5, 4, 3] },
    { name: 'Model B', values: [3, 5, 3, 5, 4] },
  ],
}, { x: 1, y: 1, w: 6, h: 5, radarStyle: 'filled', showLegend: true });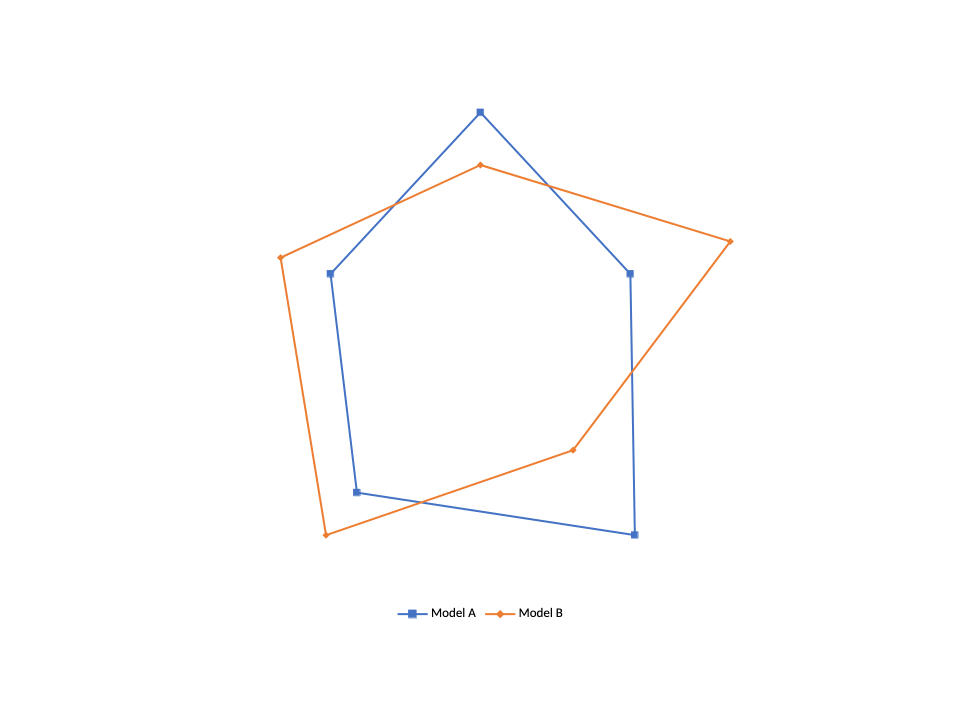
3D Column Chart
typescript
slide.addChart('col3D', {
  categories: ['Q1', 'Q2', 'Q3', 'Q4'],
  series: [{ name: 'Sales', values: [100, 150, 130, 180], color: '4472C4' }],
}, {
  x: 1, y: 1, w: 8, h: 5,
  view3D: { rotX: 15, rotY: 20, perspective: 30 },
});
Chart Options
| Option | Type | Description |
|---|---|---|
x, y | number | Position in inches |
w, h | number | Size in inches (default: 6x4) |
title | string | Chart title |
showLegend | boolean | Show legend |
legendPosition | string | 'b', 't', 'l', 'r', 'tr' |
showDataLabels | boolean | Show data labels on points |
showGridLines | boolean | Show grid lines |
barGrouping | string | 'clustered', 'stacked', 'percentStacked' |
catAxis | AxisOptions | Category axis config (title, format, min/max) |
valAxis | AxisOptions | Value axis config |
view3D | object | 3D rotation and perspective |
See ChartOptions, AxisOptions for the full reference.
Series Options
| Option | Type | Description |
|---|---|---|
name | string | Series name |
values | number[] | Data values |
color | Color | Series color (hex string or color object) |
colors | Color[] | Per-data-point colors (e.g. pie slices) |
marker | ChartMarkerOptions | Data point markers (line/scatter) |
trendline | TrendlineOptions | Add a trendline (linear, exp, log, etc.) |
errorBars | ErrorBarOptions | Error bar display |
smooth | boolean | Smooth line interpolation |
opacity | number | Series opacity (0–100) |
See ChartSeries for the full reference.