Quick Example
A complete example that creates a 5-slide presentation with various element types:
typescript
import { Presentation } from 'pptx-craft';
async function main() {
const pptx = new Presentation();
pptx.defineSlideMaster({ name: 'Corporate', background: 'F5F5F5' });
// Title slide (the 'Corporate' master provides the background for all slides)
const s1 = pptx.addSlide();
s1.addText('pptx-craft', {
x: 1, y: 1, w: 8, h: 1.5,
fontSize: 54, color: '003366', bold: true, align: 'center',
});
s1.addText('A modern TypeScript library for PowerPoint generation', {
x: 1, y: 3, w: 8, h: 1,
fontSize: 20, color: '666666', align: 'center',
});
s1.addShape('rect', { x: 1, y: 4.5, w: 8, h: 0.05, fill: '4472C4' });
s1.setNotes('Welcome slide. Introduce the library and its goals.');
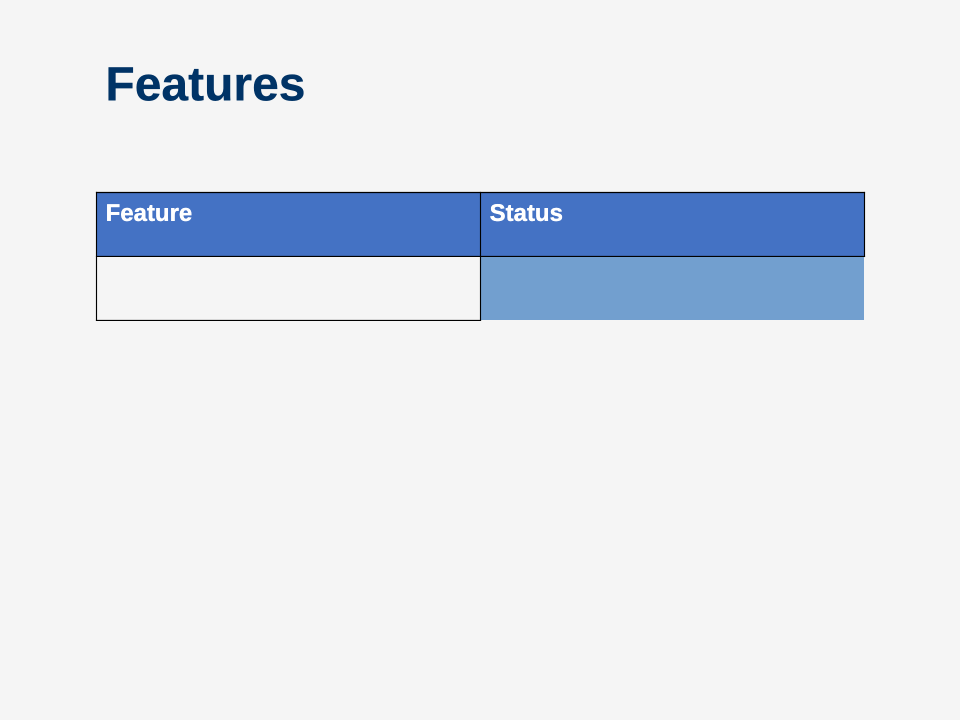
// Features table
const s2 = pptx.addSlide();
s2.addText('Features', {
x: 1, y: 0.5, w: 8, h: 1,
fontSize: 36, color: '003366', bold: true,
});
s2.addTable([
[
{ text: 'Feature', options: { bold: true, fill: '4472C4', color: 'FFFFFF' } },
{ text: 'Status', options: { bold: true, fill: '4472C4', color: 'FFFFFF' } },
],
[{ text: 'Text & Shapes' }, { text: 'Done' }],
[{ text: 'Images' }, { text: 'Done' }],
[{ text: 'Tables' }, { text: 'Done' }],
[{ text: 'Charts' }, { text: 'Done' }],
[{ text: 'Media (Video/Audio)' }, { text: 'Done' }],
], { x: 1, y: 2, w: 8, h: 4, border: { color: 'CCCCCC', width: 1 } });
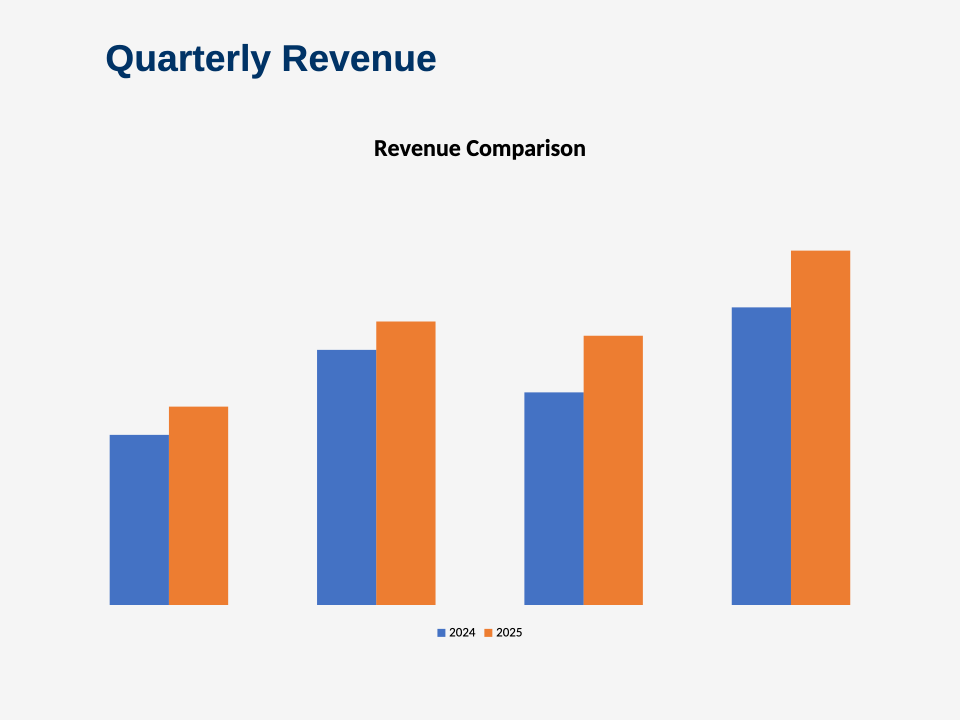
// Chart slide
const s3 = pptx.addSlide();
s3.addText('Quarterly Revenue', {
x: 1, y: 0.3, w: 8, h: 0.8,
fontSize: 28, color: '003366', bold: true,
});
s3.addChart('col', {
categories: ['Q1', 'Q2', 'Q3', 'Q4'],
series: [
{ name: '2024', values: [120, 180, 150, 210], color: '4472C4' },
{ name: '2025', values: [140, 200, 190, 250], color: 'ED7D31' },
],
}, { x: 0.5, y: 1.2, w: 9, h: 5.5, title: 'Revenue Comparison', showLegend: true });
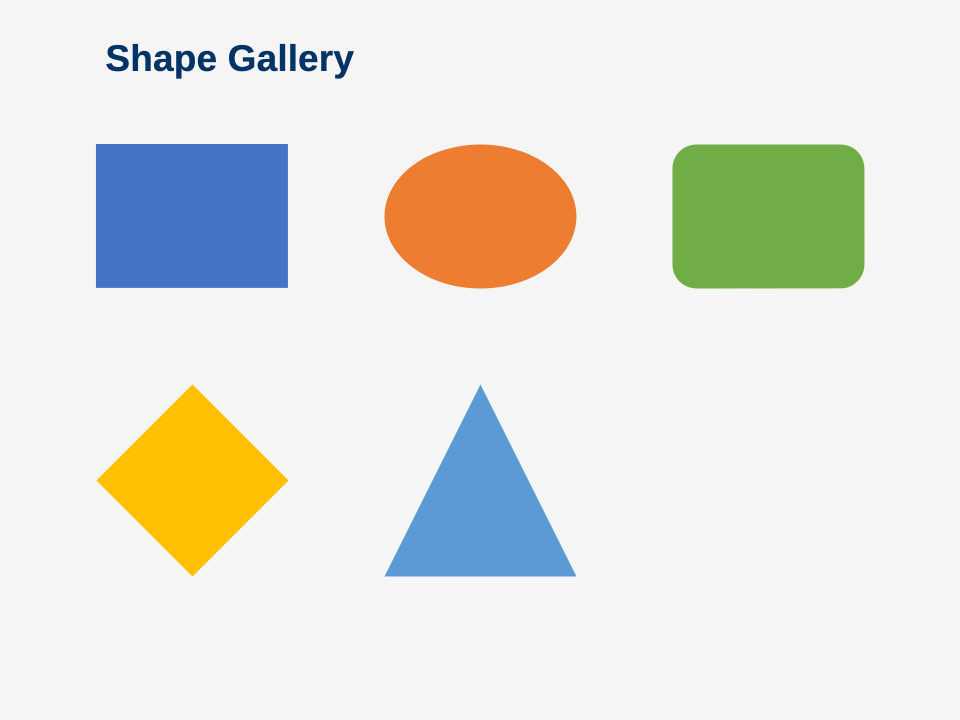
// Shapes slide
const s4 = pptx.addSlide();
s4.addText('Shape Gallery', {
x: 1, y: 0.3, w: 8, h: 0.8,
fontSize: 28, color: '003366', bold: true,
});
s4.addShape('rect', { x: 1, y: 1.5, w: 2, h: 1.5, fill: '4472C4' });
s4.addShape('ellipse', { x: 4, y: 1.5, w: 2, h: 1.5, fill: 'ED7D31' });
s4.addShape('roundRect', { x: 7, y: 1.5, w: 2, h: 1.5, fill: '70AD47' });
s4.addShape('diamond', { x: 1, y: 4, w: 2, h: 2, fill: 'FFC000' });
s4.addShape('triangle', { x: 4, y: 4, w: 2, h: 2, fill: '5B9BD5' });
await pptx.toFile('demo.pptx');
console.log('Created demo.pptx');
}
main();Output